
Gather live state through permitted read-only tools.
Self-hosted Kubernetes dashboard
Your cluster.
In clear view.
Health, logs and capacity. One workbench to see what’s happening—and decide what happens next.
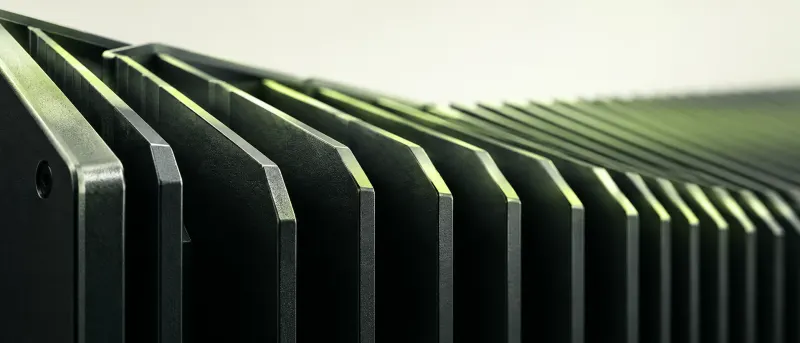
Clarity for the people on call.Berth / By Agrohi
The whole picture.
Fewer open tabs.
From endpoint health to workload readiness. Find the resource that needs attention, with the context still in view.
Explore the dashboard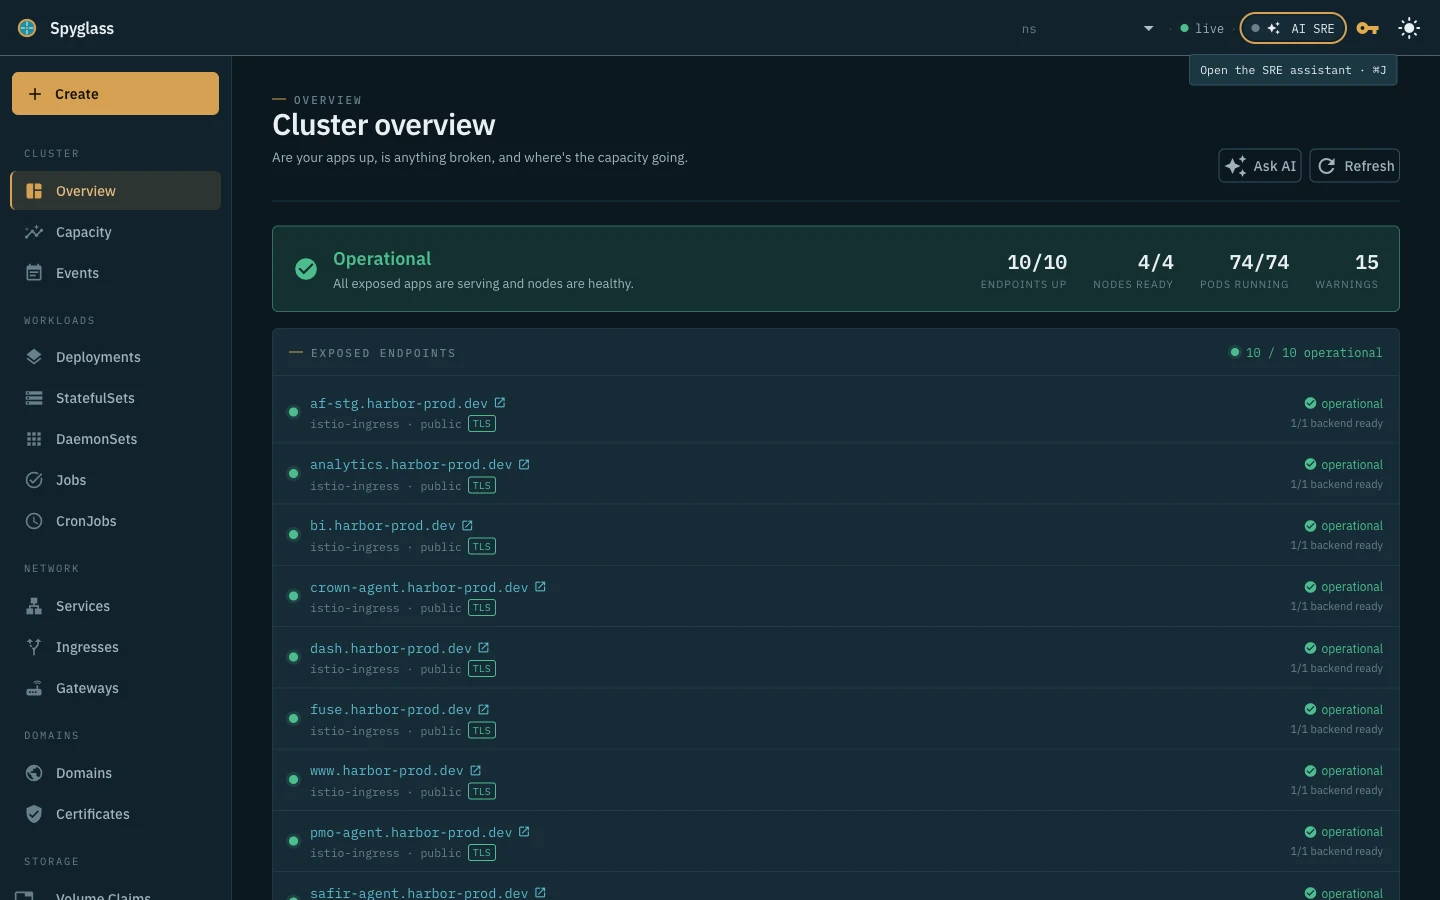
Endpoint health / Live pod logs / Workload events / Capacity planning / Read-only AI /
Follow the signal.
Start with the question. Get closer to the cause.
Find the failing connection.
Trace endpoint health through DNS, TLS, routes and backend readiness.
Keep the evidence close.
Pod status, events and live logs belong in the same investigation.
Explore workloads ↗See where capacity goes.
Compare allocatable, requested and used resources across node pools.
Understand capacity ↗From symptom
to evidence.
Bring your questions to an assistant that investigates with read-only tools.
Meet the assistant ↗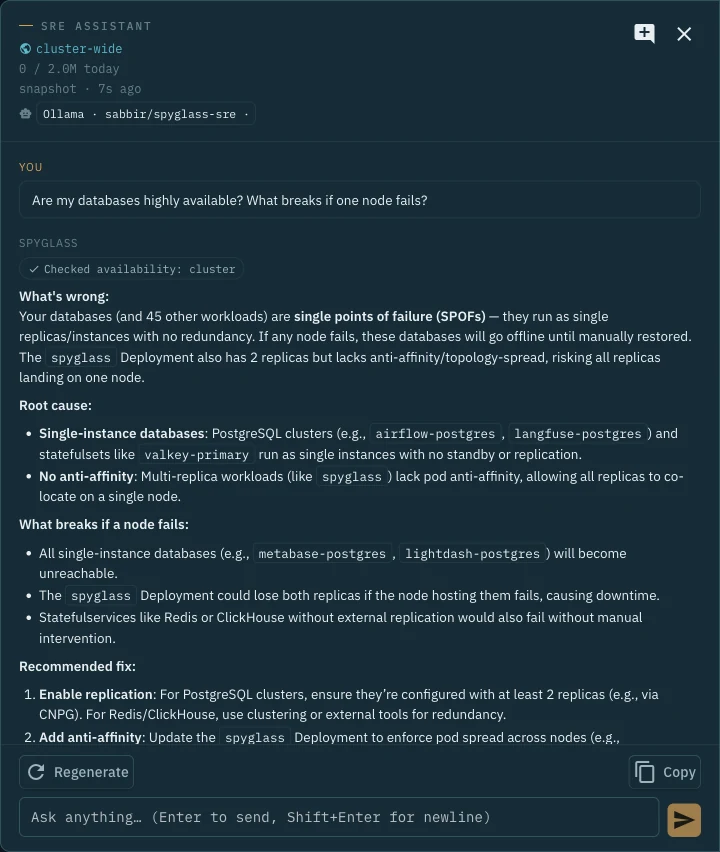
Review the explanation, tool calls and suggested fix.
You choose what to apply. The agent cannot change the cluster.
Optional AI investigation
A second set of eyes.
You stay in control.
Ask about the workload you’re viewing. The assistant gathers evidence and suggests commands or manifests for you to review.
How the AI worksConnect your own Ollama server. Enterprise also supports Anthropic and Amazon Bedrock on your account. Raw AI logs and descriptions are opt-in.
Your infrastructure.
Your call.
Run Berth where you operate. You control network access, storage and credentials.
Designed for trusted cluster administrators. Live state complements historical monitoring. Per-user cluster authorization and multi-cluster management are not available.
A clearer view
starts here.
Explore without a license. Make changes on up to 10 nodes with a free Community key. Model setup and compute are separate.
Get started free Compare editions →